![]() |
|
|
Thread Tools |
|
#301
|
|||
|
|||
|
Re: Nhận chữa bài FREE!
Quote:
|
|
#302
|
|||
|
|||
|
Re: Nhận chữa bài FREE!
Có phần viết Đoạn phục vụ sĩ tử ôn thi đại học nhưng gửi file lên đây kiểu gì mấy thím? Chèn link mediafire nhỉ?
|
|
#303
|
|||
|
|||
|
Re: Nhận chữa bài FREE!
mới mail cho bác rồi bác ơi
__________________
[QUOTE=bb_hii;33749605]Bữa nào rảnh làm phát battle đi bạn. :gach:[/QUOTE] [QUOTE=bgirl.pinpong;33749731]Bgirl luôn hả? Thix thì chiều thôi. Đây chơi style move :sogood: :gach::gach::gach::gach:[/QUOTE] [QUOTE=zolek9xx;33750055]Chơi ko cậu? Mình Bgay , sở trường thông @ss và weitei style :sogood::sogood:[/QUOTE] |
|
#304
|
|||
|
|||
|
Re: Nhận chữa bài FREE!
Topic:
You should spend about 20 minutes on this task. The charts below show UK and USA energy consumption in 2000 and 2006. Summarize the information by selecting and reporting the main features, and make comparisons where relevant. Write at least 150 words. ![]() In 2000 ![]() In 2006 Answer: The two bar charts compare UK and USA in the terms of consumption of energy in 2000 and 2006. Overall, it is clear that unrenewable resources made up for the vast majority of fuel in the two years in both countries. In 2000, there was a minor gap of 5% in the amounts of coal consumed by the two nations. Over the following 6 years, UK reduced its dependence on coal by 50% in comparison with 10% of USA. Nuclear power also witnessed a sharp drop to almost a half (8%) in UK, whereas there was an insignificant increase in USA (around 2%). By 2006, other renewable energy sources remained the least used fuel for UK and USA, with 10% and 3% respectively. A mere 2% increase was seen in the figure for USA whilst USA became more dependent on oil, with 40%, over the given period. By contrast, UK doubled its usage of gas, from 20% to 40%, and gas was the most important source of energy in the next 6 years. Meanwhile, USA witnessed a steady increase in gas usage, with 25% in 2006. |
|
#305
|
|||
|
|||
|
Re: Nhận chữa bài FREE!
Topic:
You should spend about 20 minutes on this task. The following two pie charts show the results of a survey into the popularity of various leisure activities among European adults in 1985 and 1995. Summarize the information by selecting and reporting the main features, and make comparison where relevant. Write at least 150 words. ![]() ![]() Answer: The two pie charts illustrate the changes of favorite free time activities of adults in Europe between 1985 and 1995. Overall, the most dramatic decreases were seen in talking with family and eating out while playing computer games climbed up to the second highest position in its first appearance in the latter year. First of all, it is clear that playing computer games had just appeared in 1995 and accounted for nearly a third (27%), which made up for the second largest proportion. Moreover, after the 10-year period, watching TV remained relatively stable at 30% whereas talking with friends rose up slightly, from about 21% to over a quarter (26%). Consequently, after 10 years, watching TV was still the most popular leisure activity of Europeans, followed by talking with friends and playing computer games. In 1995, talking with family and eating out both witnessed considerable drops to by almost two-thirds of their initial proportions (about 7%) compared to a similar drop for other, falling from 6% to merely 2%. |
|
#306
|
|||
|
|||
|
Re: Nhận chữa bài FREE!
Topic:
You should spend about 20 minutes on this task. The diagrams below give information on transport and car use in Edmonton. Summarise the information by selecting and reporting the main features, and make comparisons where relevant. Write at least 150 words. ![]() Answer: The pie chart illustrates the rate of the usage of transport in Edmonton and the table shows the purpose of using cars (nên thay bằng cụm khác) in city. Overall, car is the vehicle which the person in Edmonton prefer to use best (sao không nói đơn giản hơn, the most popular vehicle/ means). Moreover, they generally drive car for going to work (viết gộp vào câu trước, cẩn thận không câu này thành lý giải lại mất điểm) (work and business are the main reasons to...). The Edmontoner (rất nguy hiểm, chưa chắc từ này tồn tại) (đơn giản họ cho gì thì dùng nấy) usually use car in their life, which accounted for 45% (vế đầu viết rất dở, đây là văn cho Task 2) (vế sau thì xem lại Thời). The second most popular form of transport is the LRT. This figure is 35%. (tuyệt đối tránh viết những câu cụt lủn như thế này) The rest of mean of transports are taxi and bus. They same make up 10% of total. (cần miêu tả những điểm nổi bật nên không cần phải kiệt kê toàn bộ) The table gives more detailed information about why people use their cars. (chỉ nên đề cập theo kiểu in terms of reasons for...) (viết thế này là thành Task 2) 55% of the people need to commute to work by car compared to 45% of cars are also used a lot business purposes (nửa vế đầu tạm ổn còn chỗ này chán quá). The figure for using car for taking the children to school (câu hỏi là, có nhất thiết phải chỗ nào cũng dùng using car không) is lower, at about 40% (tham khảo Simon nhỉ, ổn). Only 15% of drivers are doing their shopping and, similarly, 15% need to travel by car for leisure. (câu này tốt, có tham khảo đâu không) Quote:
Quote:
Suggested Version: |
|
#307
|
|||
|
|||
|
Re: Nhận chữa bài FREE!
Topic:
You should spend about 40 minutes on this task. Present a written argument to an educated reader with no specialist knowledge of the following topic. In many countries there are people with extremely high income. Some say it is good for the country, while others claim that governments should limit salaries. Discuss both views and give your own opinion. Give reasons for your answer and include any relevant examples from your own experience or knowledge. Write at least 250 words. Answer: It is true that there are many people with high salary in all around the world (sử dụng phong cách paraphrase đơn giản của Simon, rất hay) (thiếu yếu tố country). While some people believe that it would boost economic activity (định thêm s mà thấy nhiều người dùng nguyên gốc) of the country, I would argue that it is better for government should be setting the maximum wage (2 cụm này sửa thành to set maximum wage limit) (đã biết như thế nào mà có the còn vế kia thì sai SVO). On the one hand, it is undeniable that hyper-rich persons (từ hay ngoại trừ chỗ persons, đừng viết thế này trong văn IELTS, dù là persons vẫn được dùng trên thực tế) have some benefit (ý bạn là sao, họ là lợi ích hay họ giữ lợi ích) in (với từ in này thì chắc là họ có lợi ích, nên là số nhiều) the society. Firstly, they are a mirror to give an impulse of individuals to work, aspire and succeed (diễn đạt rõ ràng hơn, họ là tấm gương về sự thành công,... cho nhiều người đúng không). For instance, Chief Executive of a corporation is a desirable position which most of people want to achieve (thừa, bản thân từ desirable đã đủ gợi hình tượng). This may to (lỗi cực kỳ nghiêm trọng) lead to labors working stronger and making more products, thus economic of country is increasing dramatically (bạn có vẻ thích cọp pi nhiều cụm từ nghe cao siêu nhưng cách ghép vào câu thì lại biến chúng thành thảm họa, chưa kể việc đưa ra suy diễn thus lại càng chán hơn). Secondly, it is not argued that salary should to pay by position of work (ngữ pháp gì thế này). While it may well be true that the Chief Executive of a corporation earns 250 times the wage of their most lowly employee. It is manifestly fair that their most lowly employee should earn substantively more than someone who chooses not to go to work and to rely on welfare instead. (2 câu này bạn lấy ở trên mạng chứ không tự viết đúng không) (Câu while phải có 2 vế nhé, không thể bỏ lửng thế được) On the other hand, I believe that there are more advantages in the limiting of salaries (quay lại cụm quy định mức lương cơ bản bên trên). The main advantage is that setting greater equality in society (thiếu thành phần câu). Rising wage disparities are one of the key drivers of inequality. By putting a plug on both ends of the pay scale we help ensure decent living standards for all and avoid the negative consequences (eg higher crime, poorer public health) of living in a highly unequal society. (không phải cứ cóp bừa thế nào cũng được) Another issue is that maximum salary (cần V-ing dạng Gerund nhé) help to limiting corruption in government and companies (tiếp tục bài cóp mà không để ý ngữ pháp). By insisting upon transparency of pay ratios and executive pay, we can enable and promote shareholder activism and corporate responsibility. It is right and proper that when public money is being spent there is a higher premium on fairness and we ensure no-one has their dignity impaired by employment by the taxpayer. (viết cho có) In conclusion, it seems to me that the high income should be limited in order to have a equality society (Google dịch), although some people insist on earning a lot of money be good to country (ngữ pháp). Quote:
Quote:
Suggested Version: |
|
#308
|
|||
|
|||
|
Re: Nhận chữa bài FREE!
Topic:
You should spend about 40 minutes on this task. Present a written argument to an educated reader with no specialist knowledge of the following topic. The society would benefit from a ban on all forms of advertising because it serves no useful purpose, and can even be damaging. To what extent do you agree or disagree? Give reasons for your answer and include any relevant examples from your own experience or knowledge. Write at least 250 words. Answer: Over the past few years, the world has seen a considerable rise in the number of advertising's forms. Some argued that it should be banned because of its usefulness purpose. While I accept that some kinds of advertising should be prohibited, I also think that it could bring to people many benefits. On the one hand, I agree that meaningless advertising should be forbidden. Firstly, advertising manipulates people, especially youngsters. They can easily be influenced by advertisements and put pressure on parents to buy them things. This can result in the situation that many poor parents have to save money to buy many expensive things such as toys, phones and video games for their children. Secondly, advertisers focus on selling a brand image. They usually use glamorous, successful people to encourage individual purchase their products. This can lead to the fact that many goods have a low quality, but a high price. On the other hand, I also believe that advertising could bring to community some benefits. The main advantage could be that advertisements inform us about the choices we have. Without advertising, we would have less choice. Another benefit of advertising would be that it is a creative industry that employs many people. Without advertising, there would be more unemployed. Vietnam, where many people are working in the advertisement industry, could be taken as a particularly salient example of this. For the reasons I mentioned above, I believe that while advertising has many problems, this also has some advantages. Quote:
Quote:
Suggested Version: |
|
#309
|
|||
|
|||
|
Re: Nhận chữa bài FREE!
I am really appreciate your help with other members.
keep the good work bro |
| phongthan86 |
| View Public Profile |
| Find all posts by phongthan86 |
|
#310
|
|||
|
|||
|
Re: Nhận chữa bài FREE!
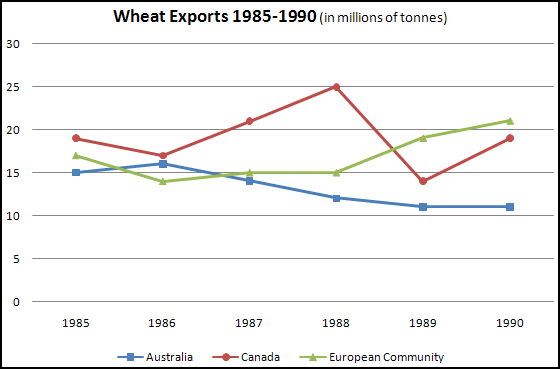
Topic:
You should spend about 20 minutes on this task. The graph below shows the differences in wheat exports over three different areas. Write a report for a university lecturer describing the information shown below. Write at least 150 words. ![]() Answer: The line graph illustrates the comparisons in exporting wheat from three separate countries between 1985 and 1990. As can be seen from the graph, the European Community saw an upward trend in its export, while Canada’s export experienced fluctuation, and Australia’s export fell. The European Community’s exports stood at about 17.000.000 tons in 1985. It saw a sudden drop to about 14.000.000 tons in 1986, then went up gradually to over 21 million tons by 1990, the highest position by the end of the period. In contrast, starting at exactly 15.000.000 tons in 1985, the tons of wheat exported from Australia increased slightly to more than 16 million tons in 1986, before witnessing a gradual decrease to over 11 millions tons by 1990. Canada’s wheat exports, meanwhile, witnessed fluctuation over the time period. It began at approximately 19.000.000 tons in 1985. In the following year, this number fell to somewhere in the vicinity of 17.000.000 tons. After that, it jumped rapidly and reached a peak of 25 million tons in 1988, before hitting a low of under 15.000.000 tons in 1989. This number then recovered, rising to around 19.000.000 tons by the end of the period. Quote:
Quote:
Suggested Version: |
![]() |
|
|